Introduction
JDK 27 enables compact object headers by default ( JEP 534 ), which shrinks the header of every object from 96 to 64 bits and, according to the JEP, can reduce the heap size of a Java application significantly. We pay for memory when we run containers in the cloud, so this got my attention immediately.
The application under test: alf.io
alf.io is a free and open source ticketing and attendance management system for events. It covers the whole life of an event: ticket sales, attendee data, invoices, check-in and reporting.
If you’d rather not run it yourself, Swicket , run by the same people who develop alf.io, offers it as a managed service.
Under the hood, alf.io is a Spring Boot application backed by PostgreSQL, so most of what follows applies to any Spring Boot service.
Why JDK 27
The source code of the next alf.io release targets Java 25, and the application ships as a small Docker image (Alpine and a JRE built with jlink) that runs on JDK 25.
At Devoxx Belgium 2026 I met my friend Francesco (Franz) Nigro , the best performance engineer I know, and we talked about going one step further and running alf.io on JDK 27, because of compact object headers. A newer JDK can run the same jar without any change to the code: switching to JDK 27 only means changing the runtime in the image.
I learned then that we can do much more than that. So, besides the JDK, I also tried tuning the garbage collector and the heap size, and Project Leyden’s AOT cache, which should help the application reach peak performance sooner after a deployment.
Franz also told me how to measure it properly: warm up the application before measuring anything, use a fixed throughput (so that all configurations do the same work in the same time), and look at the CPU usage of the JVM’s own threads and at the time spent compiling code. So I did.
TL;DR: compared to the JDK 25 image of our next release, JDK 27 with an AOT cache, ParallelGC and a 384 MB heap
- starts 36% faster
- uses 16% less memory and 25% less CPU
- answers 25% faster at the 95th percentile
If you train the AOT cache with real traffic, the JIT compiler also does 27% less work during the warm-up. The price of choosing ParallelGC is longer worst-case GC pauses: up to 141 ms, where G1 on JDK 25 never went beyond 66 ms.
The contenders
In a first, rougher round of measurements I learned two things:
- With the default ergonomics, G1 on JDK 27 let the heap grow to its maximum and kept it there, so the container used more memory than on JDK 25, even though the live data was much smaller. To get the memory back, you have to set the heap size yourself.
- Our image never used its AppCDS archive (more on this below).
Testing every combination of JDK, GC, heap size and cache would have meant days of runs, so I picked two realistic options: the image of our next release, and the best configuration I could come up with.
| JDK 25 (next release) | optimized | |
|---|---|---|
| Runtime | Azul Zulu 25 (25.0.4.1+1-LTS) | Eclipse Temurin 27 (27+35) |
| Garbage collector | G1 | ParallelGC |
| Heap | -Xms512m -Xmx512m | -Xms384m -Xmx384m |
| Startup optimization | AppCDS archive (broken) | Leyden AOT cache |
512 MB is the maximum heap that the JVM picks by default in a 2 GB container (25% of the memory), so pinning it doesn’t change much compared to the defaults.
Azul doesn’t publish an Alpine image for JDK 27 yet, so the optimized image uses Temurin.
The optimized configuration comes in two variants, which differ only in how the AOT cache is trained:
- aot: the cache is created during
docker build, by starting the Spring context and exiting. - aot-workload: the cache is created by running the application under load for 5 minutes.
Keep in mind that the optimized configuration changes three things at once (JDK, GC, heap size), and this benchmark can’t tell which one is responsible for what. I did that on purpose: I wanted to know whether the new image is better than the JDK 25 one, and that’s what I measured.
A bug I didn’t know we had
While checking the container logs, I noticed this line at startup:
[cds] Dynamic archive cannot be used: static archive header checksum verification failed.
Our image generates an AppCDS archive at build time, to speed up the startup. It turns out that we have never used it.
The archive was generated with the java binary of the full JDK, but at runtime we load it with the jlink-ed JRE, which has its own base CDS archive.
The JVM detects the mismatch and silently ignores our archive.
The fix is one line: generate the archive with the runtime that will load it (/jlinked/bin/java instead of $JAVA_HOME/bin/java).
If you build a custom runtime with
jlinkand use AppCDS: check your logs with-Xlog:cds. You might be in the same situation.
The JDK 25 configuration in this benchmark keeps the bug, as it is in the image of our next release. The optimized one replaces AppCDS with the AOT cache, which came with problems of its own.
The Leyden AOT cache
Project Leyden’s AOT cache arrived with JDK 24 (
JEP 483
) and has grown with every release since.
On JDK 27 it holds the classes, already loaded and linked, the method profiles collected during the training run (
JEP 515
), and some compiled code (adapters and stubs).
Since JDK 25 you can create it in a single step with -XX:AOTCacheOutput (
JEP 514
).
Spring Boot makes the training easy: with -Dspring.context.exit=onRefresh, the application starts the context and exits right away.
Our app-cds profile, which we already had for AppCDS, lets the application start without a database. This is the training step in the build stage of the Dockerfile:
ARG GC_OPTS="-XX:+UseParallelGC"
# [...]
RUN "$JAVA_HOME/bin/java" -Djarmode=tools -jar alfio-boot.jar \
        extract --destination /cds && \
    (cd /cds && /jlinked/bin/java $GC_OPTS \
        --add-modules jdk.jfr -Xmx1g \
        -XX:AOTCacheOutput=alfio.aot \
        -Dspring.profiles.active=app-cds \
        -Dspring.context.exit=onRefresh \
        -jar alfio-boot.jar)
The runtime image uses the same GC by default, and loads the cache:
FROM alpine:3.19
ARG GC_OPTS
ENV ALFIO_GC_OPTS="${GC_OPTS}"
# [...]
CMD /opt/jdk/bin/java $ALFIO_GC_OPTS $ALFIO_JAVA_OPTS \
    $ALFIO_PERFORMANCE_OPTS -XX:+UseContainerSupport \
    --add-modules jdk.jfr -XX:AOTCache=alfio.aot \
    -jar alfio-boot.jar
Each flag in the training command fixes a problem I ran into:
| Flag | Why |
|---|---|
/jlinked/bin/java | the cache must be created by the runtime that will load it, as for AppCDS |
--add-modules jdk.jfr | trap 1: JFR |
-Xmx1g | trap 2: compressed oops |
$GC_OPTS | trap 3: the garbage collector |
Trap 1: JFR disables the cache
The JVM uses the cache only if the runtime matches the training run, and that includes the set of modules.
Starting a recording with -XX:StartFlightRecording adds the jdk.jfr module, so the JVM disables the full module graph, and the AOT cache with it.
By default (-XX:AOTMode=auto) this happens silently: the application starts, just slower.
I noticed it only because the startup time with JFR enabled was the same as without the cache.
The fix is to add jdk.jfr explicitly, with --add-modules jdk.jfr, both in the training run and at runtime.
The mismatch works in both directions: a JVM started without JFR can’t use a cache trained with it.
Trap 2: compressed oops
An oop ( ordinary object pointer ) is what HotSpot calls a reference to a Java object. On a 64-bit JVM, if the heap is smaller than 32 GB, the JVM stores these references in 32 bits instead of 64 to save memory: these are the compressed oops. How it encodes them depends on the size of the heap.
My build machine has more than 4 GB of memory, so during docker build the JVM picked a large default heap, and with it a different compressed oops encoding than the one used in a 2 GB container.
The cached code depends on that encoding, so the JVM threw it away at runtime, while still using the rest of the cache.
Training with -Xmx1g fixes it.
Trap 3: the cached code is GC-specific
When I switched the optimized configuration to ParallelGC, the cache trained with G1 lost 911 code entries. The code is compiled for a specific garbage collector, so the GC of the training run must match the one used at runtime.
That’s why GC_OPTS is a build argument, used both for the training and as default value for ALFIO_GC_OPTS. You can still pick another GC at runtime; you lose the cached code and keep the rest.
For the benchmark I started every container with
-XX:AOTMode=on, which makes the JVM fail at startup if it can’t use the cache. I recommend it whenever you measure something with an AOT cache: without it, the only sign of an ignored cache is a slower application.
Training with real traffic
A cache trained at startup knows nothing about the code that runs when somebody buys a ticket.
For the second variant I started the optimized image with -XX:AOTCacheOutput, sent 5 minutes of the benchmark workload at 5 journeys per second (about 110 HTTP requests per second, see below), and stopped the container.
The JVM writes the cache on exit, and a small Dockerfile copies it on top of the image.
The cache grows from 107 MB to 157 MB. Doing this in a CI pipeline means starting a database and generating traffic during the build, which our pipeline doesn’t do today.
How I measured
The workload
The load generator is a Gatling simulation. It follows an open model: new visitors arrive at a fixed rate, whether the server is fast or slow, so the throughput is the same for all configurations.
Every arrival is a “journey”, which makes about 22 HTTP requests on average:
- three anonymous visits to the event page: the server-rendered page and the API calls of our frontend
- a purchase: the buyer reserves 1 to 4 tickets, fills in the attendee data and confirms with bank transfer or on-site payment. 10% of the carts are abandoned, 30% of the buyers ask for an invoice.
Admin API calls run alongside: event statistics, and a full export of the attendees.
Every random choice is derived from the journey index, so every run sends exactly the same requests.
Each run starts from a fresh copy of a database with a published event of 50,000 seats.
Finding the rate
Franz’s rule: measure at 80% of the maximum load of the slowest configuration. To find the maximum, a script runs probes of increasing rate (30 seconds of ramp-up, 2 minutes at constant rate), until the 95th percentile goes above 500 ms or more than 1% of the requests fail.
The JDK 25 configuration handles 9 journeys per second (about 195 requests per second), the optimized one 8.5 (about 185). The measured runs therefore use 6.8 journeys per second, about 148 HTTP requests per second.
The machine
All the tests ran on my laptop:
- Lenovo ThinkPad X1 Carbon Gen 12, 32 GB of RAM, Ubuntu 26.04, Docker 29.9
- Intel Core Ultra 7 155U: 2 performance cores with Hyper-Threading, 8 efficiency cores and 2 low-power efficiency cores
The alf.io container gets the two hardware threads of one performance core, so the JVM sees 2 CPUs.
Gatling runs on the efficiency cores (pinned with taskset).
PostgreSQL runs in another container on the same laptop, without pinning, so it shares the CPUs with everything else.
A run
- Start the container: 2 dedicated CPUs (
--cpuset-cpus), 2 GB of memory, JFR (settings=profile, plus every JIT compilation) and Native Memory Tracking - 30 seconds idle
- 2 minutes of ramp-up, from 10% to 100% of the rate
- 3 minutes at constant rate: the warm-up
- 8 minutes at constant rate: the measurement
- 60 seconds idle, then stop the container
During the run, pidstat -t records the CPU usage of every thread of the JVM, which I grouped by component: GC threads, JIT compiler threads, Jetty threads, scheduled jobs, and so on.
I ran each configuration 3 times, alternated (JDK 25, aot, aot-workload, JDK 25, …), so that any drift of my machine affects all of them. The runs are very consistent: within a configuration, the resident memory differs by less than 5 MB from run to run, the startup time by less than a second. All 9 runs sent 107,187 requests, without a single error.
The analysis reads the JFR recordings with the jdk.jfr.consumer API, together with the pidstat output and the latency of each request, and computes the medians.
JFR and NMT are not free, and their overhead is included in all the memory numbers below, for all configurations.
Startup
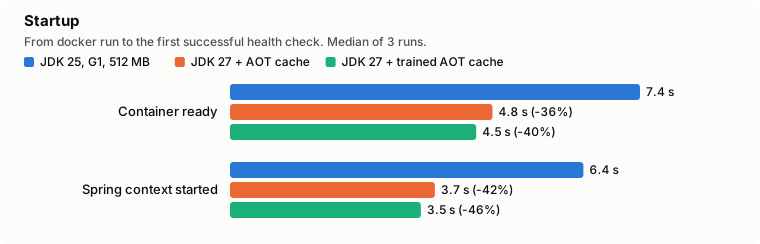
From docker run to the first successful health check, the JDK 25 image needs 7.4 seconds.
The AOT cache brings it down to 4.8 seconds, or 4.5 if trained with real traffic.
For a Spring Boot application of this size, I’ll gladly take that.
Warm-up
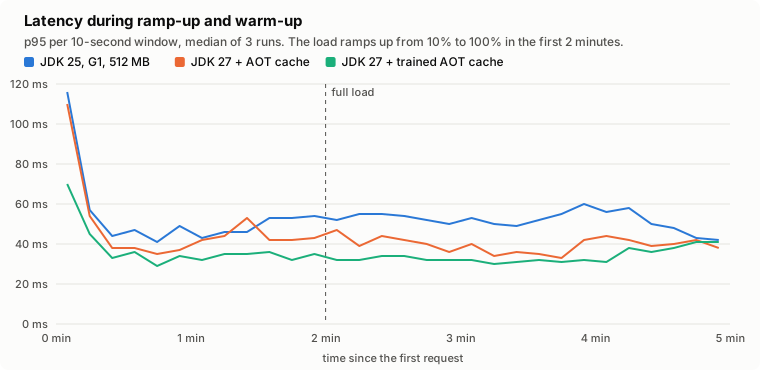
This is the phase I was most curious about. During the first 5 minutes the JIT compiler is busy, and the latency is higher than at steady state.
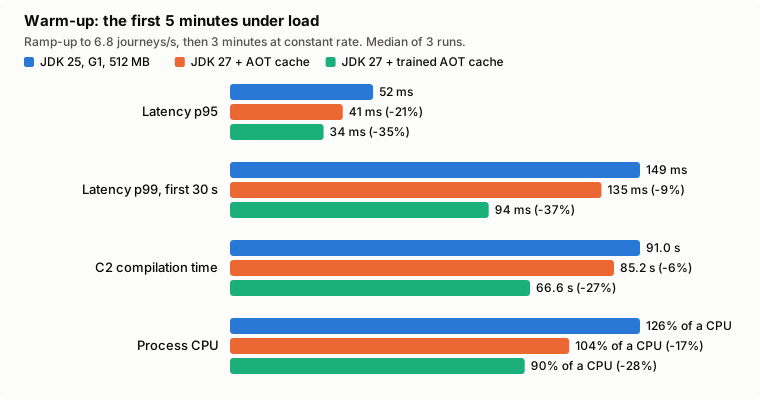
The cache trained at startup does little for the warm-up: the JVM spends 6% less time in C2 (the optimizing JIT compiler) than on the JDK 25 image.
Most of the 21% improvement in the 95th percentile comes from the other changes. In the first minute, the aot and JDK 25 configurations have about the same latency.
With the cache trained on real traffic, the JVM already has the profiles of the methods that handle a purchase. It needs 17% fewer compilations, and spends 27% less time in C2. The 99th percentile in the first 30 seconds drops from 149 to 94 ms.
The JIT is the bottleneck here. With 2 CPUs, the JVM starts a single C2 compiler thread. While C2 compiles a method, every other method waits in the queue.
Following Franz’s suggestion, I let Claude Code analyze the results using the Jafar MCP server on the first run of each configuration, to see where C2 spends its time:
| C2 compilation time, whole run | JDK 25 | JDK 27 + AOT cache | JDK 27 + trained AOT cache |
|---|---|---|---|
| PDF and calendar libraries | 38 s | 37 s | 31 s |
| alf.io | 19 s | 11 s | 12 s |
| Spring | 16 s | 16 s | 13 s |
| Everything else | 52 s | 49 s | 40 s |
| Total | 125 s | 114 s | 97 s |
The biggest share goes to the libraries that render the PDF tickets and invoices (openhtmltopdf, PDFBox) and the calendar attachments (biweekly).
The longest compilations on the JDK 25 image are alf.io methods on the purchase path:
- a lambda in
TicketCategoryAvailabilityManager.getTicketCategories: 1.0 s ReservationApiV2Controller.getReservationInfo: 0.9 sNotificationManager.processMessage: 0.9 sEventLoader.loadEventInfo: 0.8 s
On JDK 27, with either cache, no single alf.io method takes longer than 0.7 seconds to compile. The workload-trained cache saves time everywhere else: in the PDF libraries, in Spring and in the rest of the code.
Part of the compilation work moves to later. During the measurement window, after the warm-up, the workload-trained configuration compiles more methods with C1 than the other two, probably the ones that didn’t run during the training. Over the whole run, it still spends 23% less time compiling.
Steady state
Memory
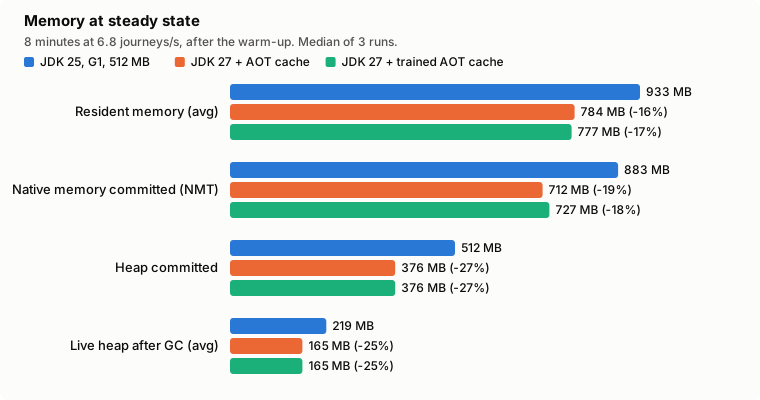
The resident memory drops by 16-17%, from 933 MB to about 780 MB.
The live data after GC goes down by 25%, from 219 to 165 MB. That’s where I expect the effect of compact object headers, which are enabled by default on JDK 27 ( JEP 534 ). They were already available in JDK 25 ( JEP 519 ), but you had to enable them explicitly. alf.io allocates a lot of small objects, and each one has a smaller header on JDK 27.
With the heap at 384 MB, the committed heap is 136 MB smaller than on the JDK 25 image.
The metaspace drops from 104 MB to 48 MB (22 MB with the workload-trained cache). Take this with a grain of salt: the classes loaded from the AOT cache live in a memory-mapped region, which is accounted elsewhere. The committed native memory reported by NMT, which includes that region, is 18-19% lower.
That doesn’t come from the JDK upgrade alone, but 16% less memory on every instance we run adds up.
CPU and latency
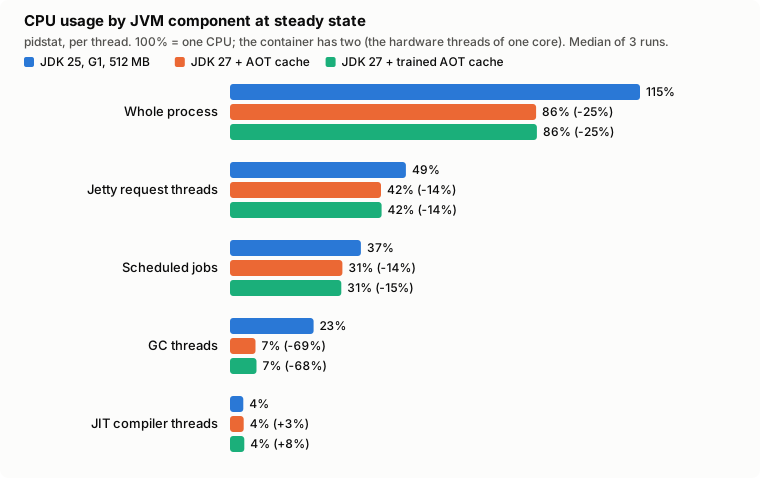
The optimized configuration uses 25% less CPU to serve the same traffic: 86% of a CPU instead of 115%.
The biggest difference is in the GC threads, from 23% to 7% of a CPU. ParallelGC does all its work during the pauses, while G1 also runs concurrent threads alongside the application.
The application threads need less CPU too: 14% less for Jetty’s request threads and for the scheduled jobs (which send the confirmation emails).
The JIT threads use less than 4% of a CPU at steady state, in all configurations.
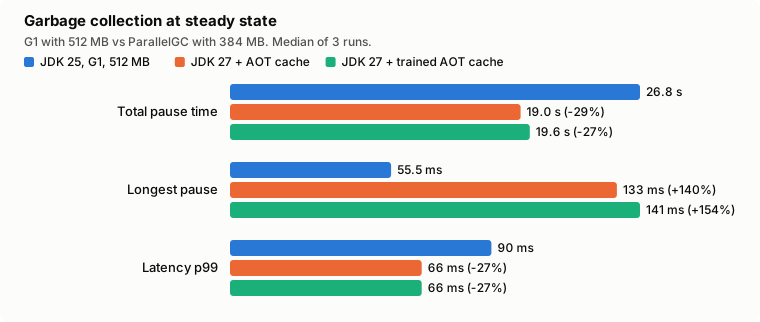
The latency follows: the median goes from 10 to 8 ms, the 95th percentile from 48 to 36 ms, the 99th from 90 to 66 ms. The total time spent in GC pauses during the 8 minutes is 29% lower, even though ParallelGC collects more often.
The longest pause, on the other hand, grows from 55 ms to 133 ms (141 ms with the workload-trained cache). ParallelGC runs full collections of the old generation, which take 130-190 ms with a 384 MB heap, while G1 never paused longer than 66 ms in any run.
At 6.8 journeys per second this doesn’t show up in the 99th percentile. Near saturation it does: the optimized configuration fails the capacity test at 9 journeys per second, and the JDK 25 one passes it.
Conclusion
I started from a promise of a significantly lower memory usage. JDK 27 alone doesn’t make the container smaller: with the default ergonomics, G1 uses the memory saved by compact object headers to keep a bigger heap. Together with a smaller heap, ParallelGC and an AOT cache, alf.io needs 16% less memory and 25% less CPU, and starts 36% faster.
What I learned along the way:
- Set the heap size explicitly. The default ergonomics won’t give you the memory back.
- Check that your startup optimizations are actually used. Our AppCDS archive never was, and the JVM can silently drop the AOT cache because of JFR, the compressed oops encoding or the garbage collector. Use
-XX:AOTMode=onwhile testing. - If warm-up matters to you, train the AOT cache with real traffic. A cache trained at startup helps the startup, and not much else.
- ParallelGC fits a small heap on 2 CPUs well, as long as you can live with pauses of 100-200 ms.
The Dockerfile change, with JDK 27, the AOT cache and ParallelGC, is ready. A benchmark on my laptop is still a benchmark on my laptop, though: the real test will be production.
The benchmark suite is on GitHub . I’d recommend running something like it before trusting any performance claim, including mine. Measure, don’t guess!